 Catalogue PIGMA
/Activités et Usages/Transport maritime et Ports
Type of resources
Available actions
Topics
Keywords
Contact for the resource
Provided by
Years
Formats
Representation types
Update frequencies
status
Scale
Resolution
-
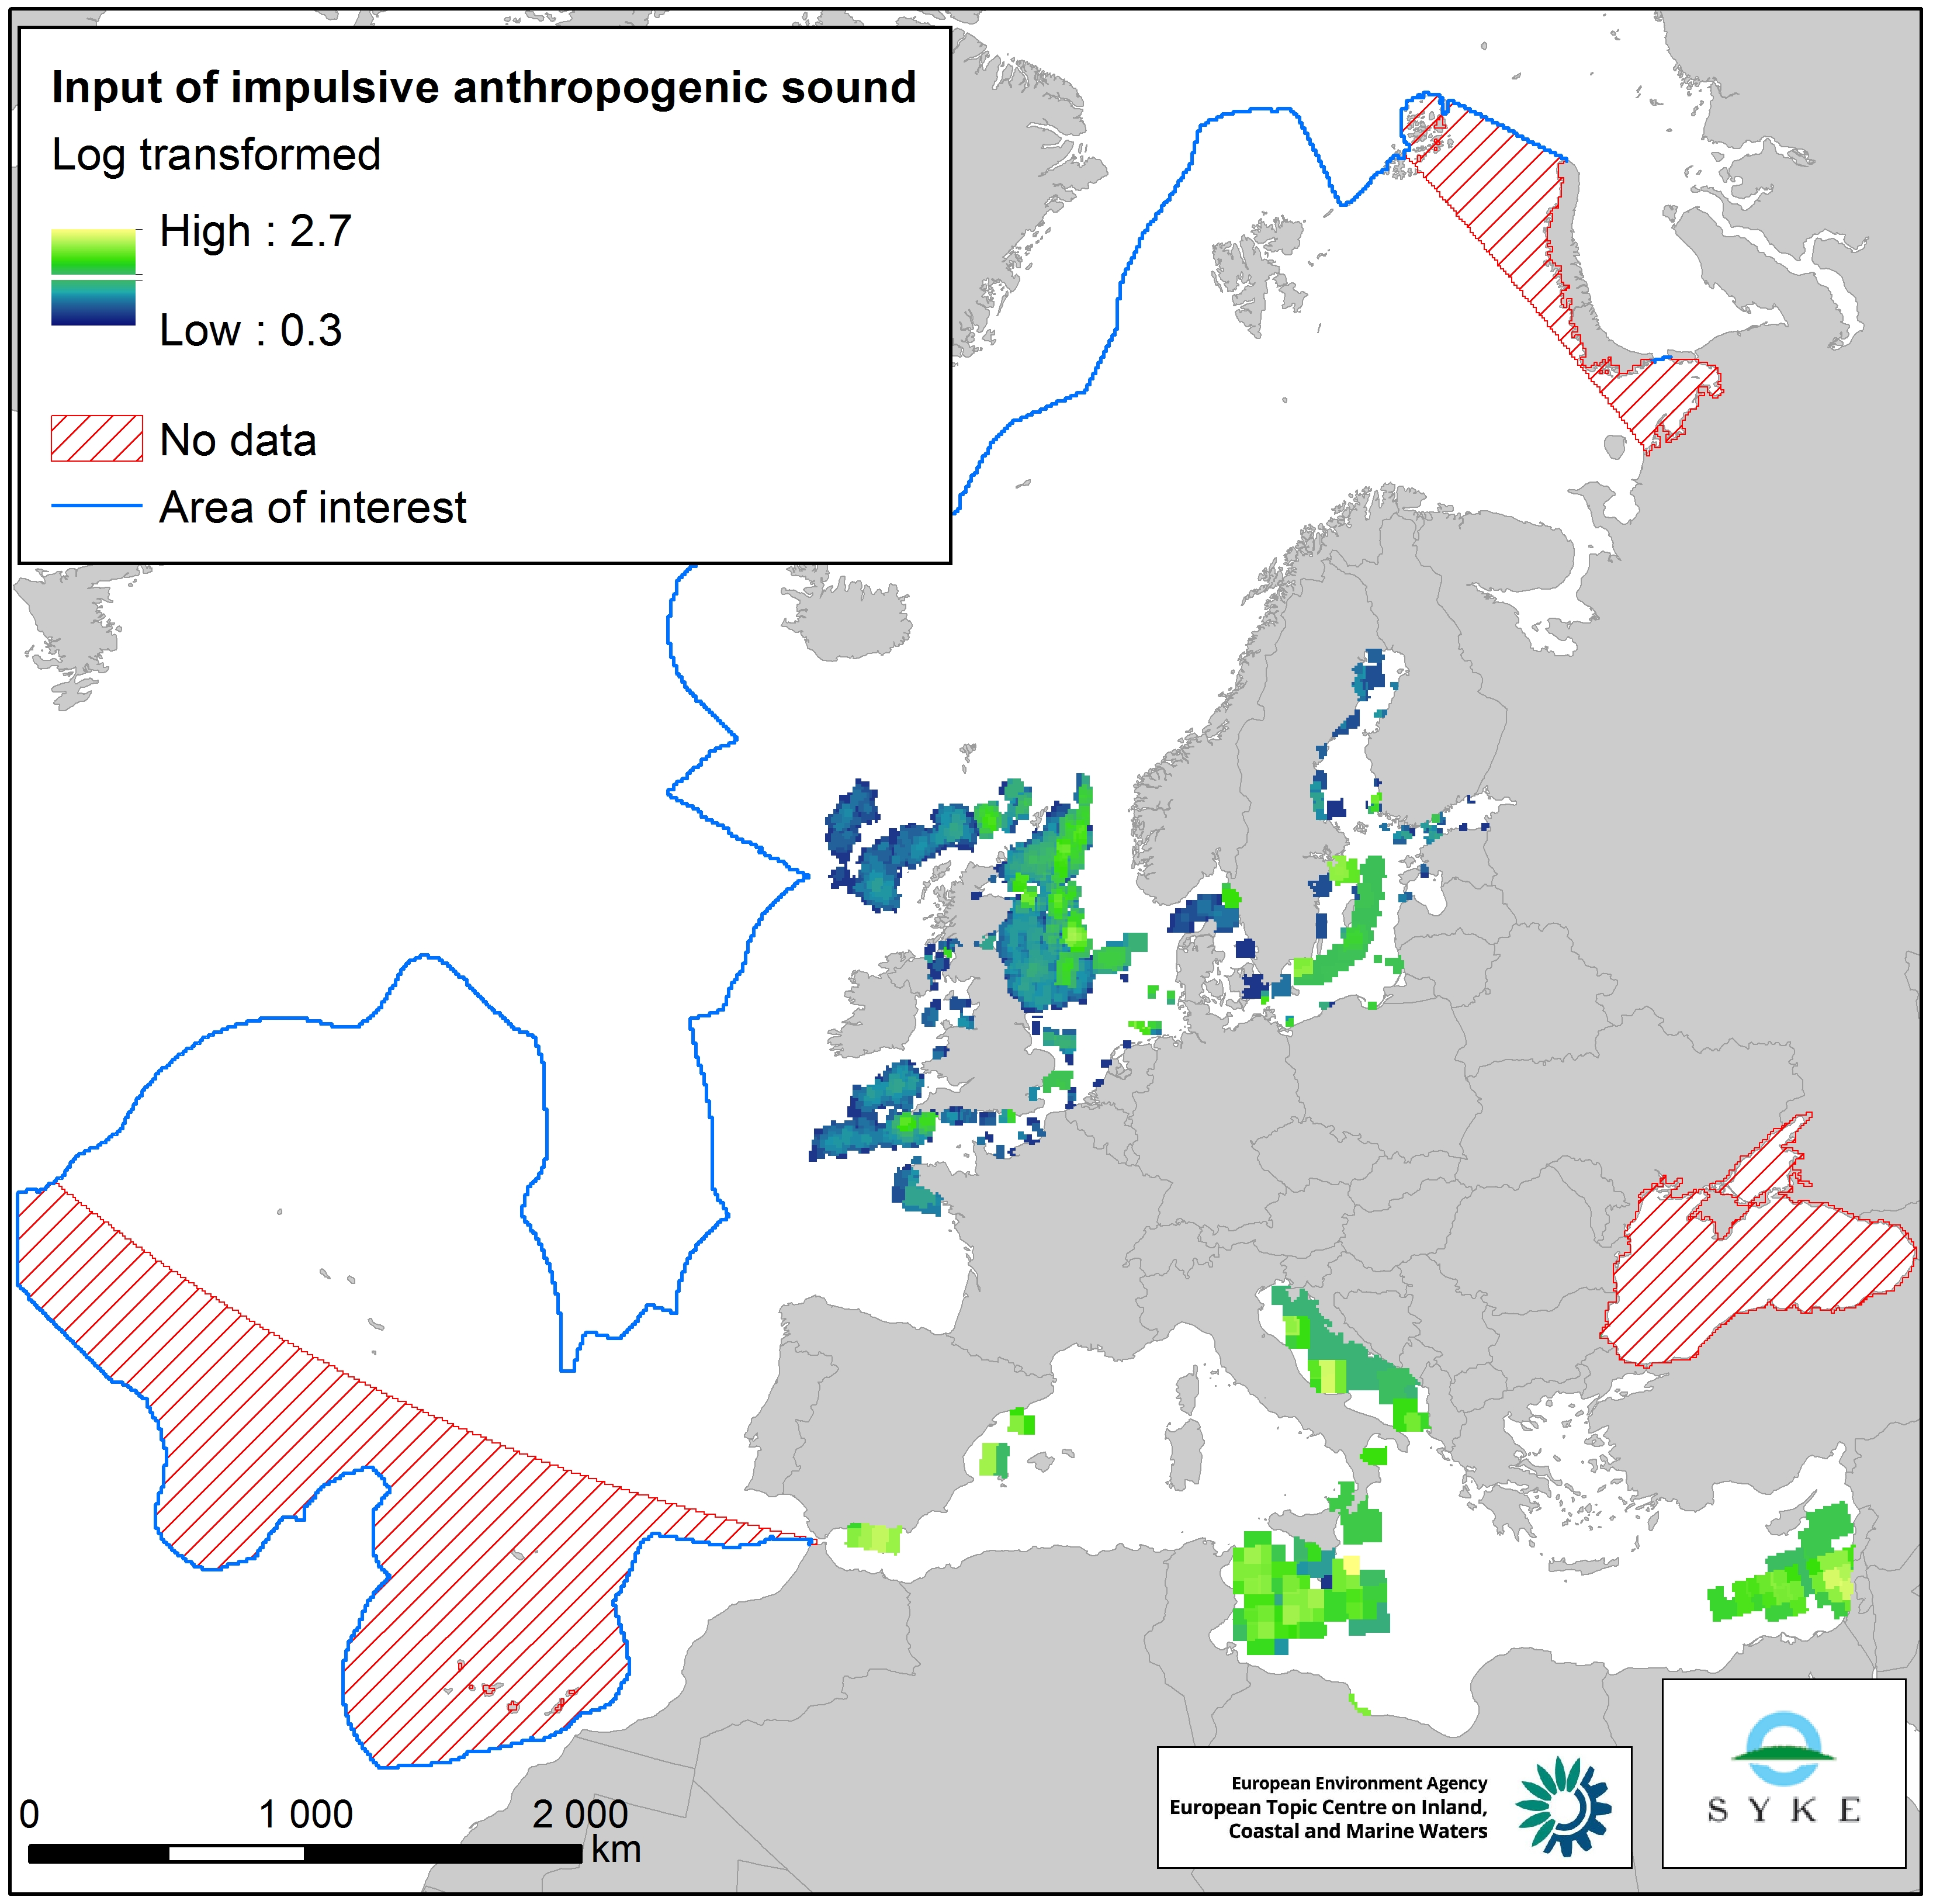
This raster dataset represents input of impulsive anthropogenic sound in Europe Seas. Impulsive sounds are typically brief with a rapid rise time, i.e. a great change in amplitude over a short period of time. The main anthropogenic sources of impulsive underwater noise are typically impact pile driving for inshore and offshore construction, seismic exploration with airguns, explosions and sonar systems. The dataset was created by combining pulse-block-days (PBD) data from the ICES Registry (for HELCOM and OSPAR areas) and ACCOMBAS (for the Mediterranean Sea), resampled using the EEA 10 km grid. The dataset does not include the Black Sea. The temporal reference of this dataset is the period 2014-2016. The cell values have been transformed into a logarithmic scale (log10). This dataset has been prepared for the calculation of the combined effect index, produced for the ETC/ICM Report 4/2019 "Multiple pressures and their combined effects in Europe's seas" available on: https://www.eionet.europa.eu/etcs/etc-icm/etc-icm-report-4-2019-multiple-pressures-and-their-combined-effects-in-europes-seas-1.
-

The dataset presents the potential combined effects of sea-based pressures on marine species and habitats estimated using the method for assessment of cumulative effects, for the entire suite of pressures and a selected set of marine species groups and habitats by an index (Halpern et al. 2008). The spatial assessment of combined effects of multiple pressures informs of the risks of human activities on the marine ecosystem health. The methodology builds on the spatial layers of pressures and ecosystem components and on an estimate of ecosystem sensitivity through an expert questionnaire. The raster dataset consists of a division of the Europe's seas in 10km and 100 km grid cells, which values represents the combined effects index values for pressures caused by sea-based human activities. The relative values indicate areas where the pressures potentially affect the marine ecosystem. This dataset underpins the findings and cartographic representations published in the report "Marine Messages" (EEA, 2020).
-
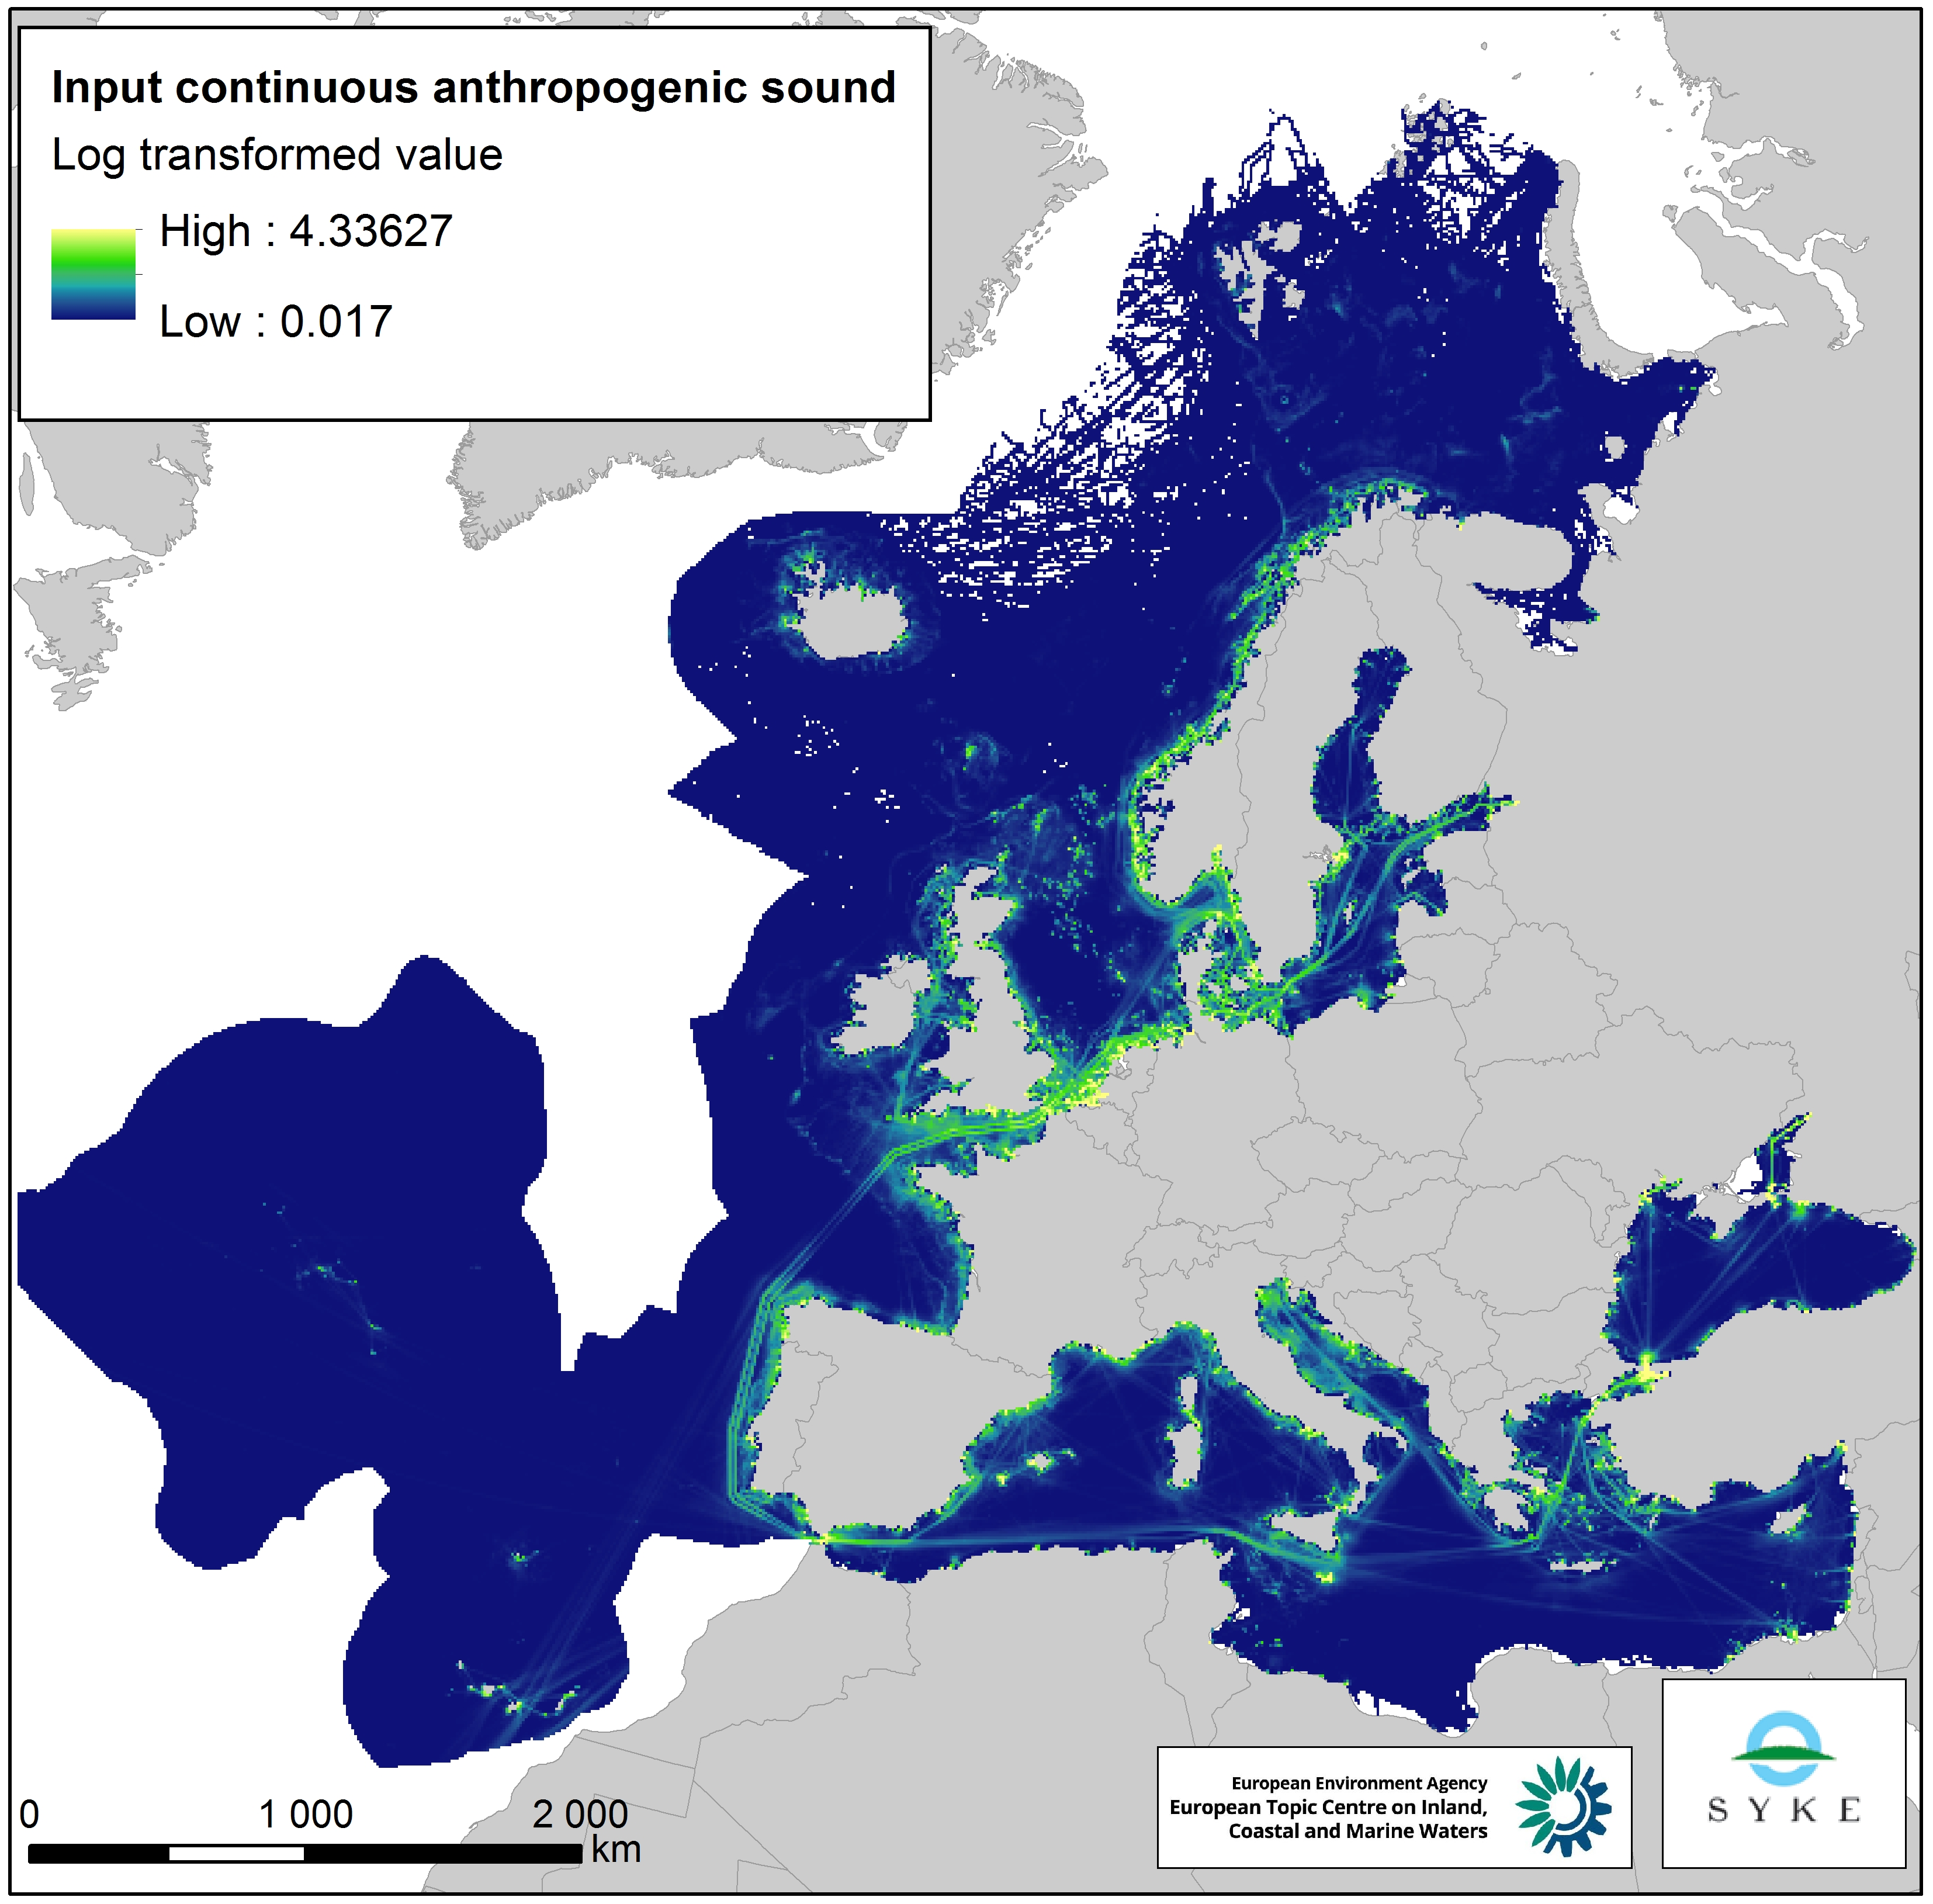
This raster dataset represents the input of continuous anthropogenic sound in the European Seas. Continuous anthropogenic underwater noise is found in the entire European marine area and is mainly produced by maritime traffic. As no thresholds for pressure have been agreed yet, even areas of low or infrequent maritime traffic are included as pressures. This dataset uses shipping density as a representation of distribution of continuous underwater noise. This dataset is based on a truncated version of the EMODnet (Automatic Identification System) AIS based vessel density dataset for 2017 (all ships, year average). The vessel density was rescaled from a 1 km to 10 km resolution (mean values) using the EEA 10 km grid. The dataset has been transformed to a logarithmic scale (ln1). This dataset has been prepared for the calculation of the combined effect index, produced for the ETC/ICM Report 4/2019 "Multiple pressures and their combined effects in Europe's seas" available on: https://www.eionet.europa.eu/etcs/etc-icm/etc-icm-report-4-2019-multiple-pressures-and-their-combined-effects-in-europes-seas-1.
-
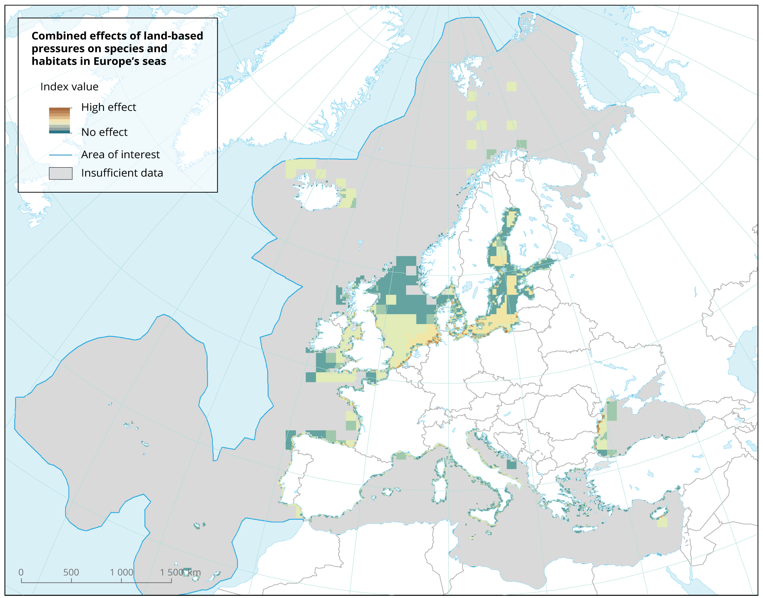
The dataset presents the potential combined effects of land-based pressures on marine species and habitats estimated using the method for assessment of cumulative effects, for the entire suite of pressures and a selected set of marine species groups and habitats by an index (Halpern et al. 2008). The spatial assessment of combined effects of multiple pressures informs of the risks of human activities on the marine ecosystem health. The methodology builds on the spatial layers of pressures and ecosystem components and on an estimate of ecosystem sensitivity through an expert questionnaire. The raster dataset consists of a division of the Europe's seas in 10km and 100 km grid cells, which values represents the combined effects index values for pressures caused by land-based human activities. The relative values indicate areas where the pressures potentially affect the marine ecosystem. This dataset underpins the findings and cartographic representations published in the report "Marine Messages" (EEA, 2020).
-

Les données du trafic de passagers transitant par les ports français sont issues du chapitre 5 du Mémento de statistiques des transports 2019 (dédié au transport maritime) et des Tableaux de l'économie française 2020 (volet Transports de voyageurs).
-

Résumé
-
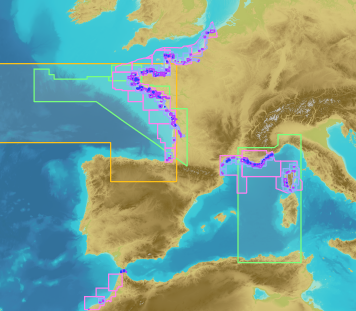
These maps are prepared on the basis of vector-based mapping data (IHO S-57 format) including the detailed description of each object (beacons, wrecks, submarine cables, regulated zones, survey systems, etc.). These maps are the digital equivalent of printed nautical charts.
-
Le chapitre 5 du mémento de statistiques des transports 2019 est dédié au transport maritime. Les volumes et les catégories de marchandises transitant par les ports français y sont rapportés.
-
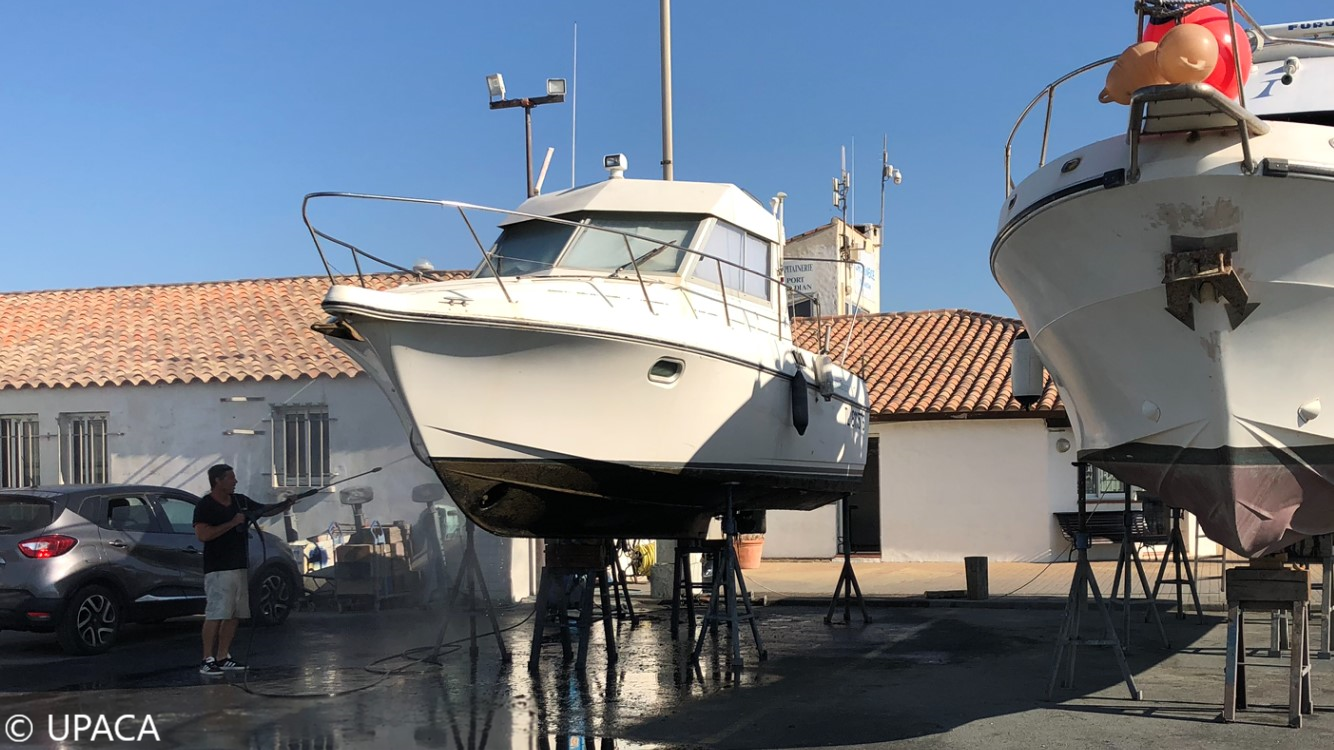
Données présentant le nombre de ports de plaisance maritimes certifiés « Ports Propres » en Provence Alpes Côte d’Azur, en Corse, en Occitanie et en Principauté de Monaco en juillet 2021.
-
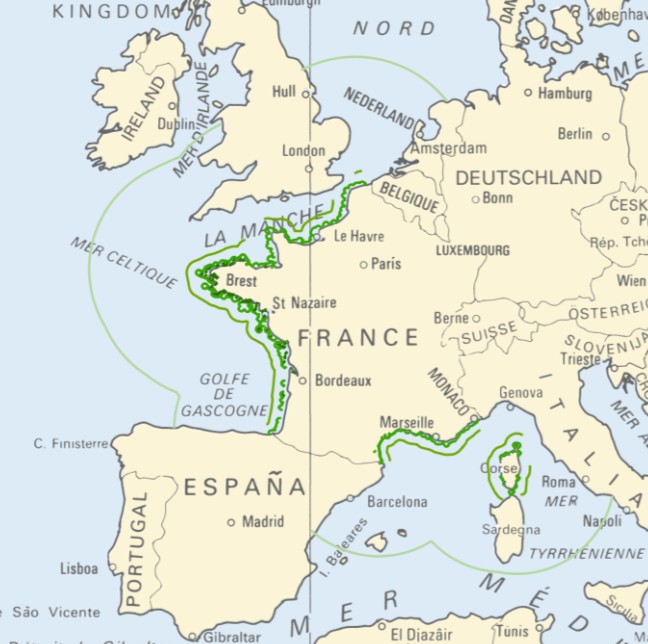
<strong>This data is not up to date with the order dated 30 August 2021 amending the order dated 23 November 1987 on ship safety, which now raises the limit for category 4 ships to 5 miles from the nearest coast.</strong> The navigation category allocated to a ship is indicated on its shipping license, together with any applicable restrictions. This limit was produced by Shom in application of section II.14 of article 1 of decree no. 84-810 amended on 30 August 1984. Navigation categories are defined in article 110.10 of the rules appended to the order of 23 November 1987 on shipping safety.